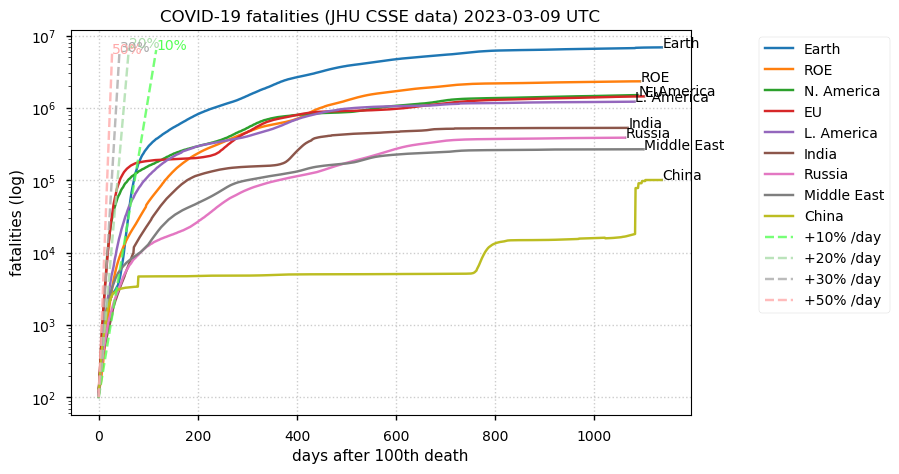
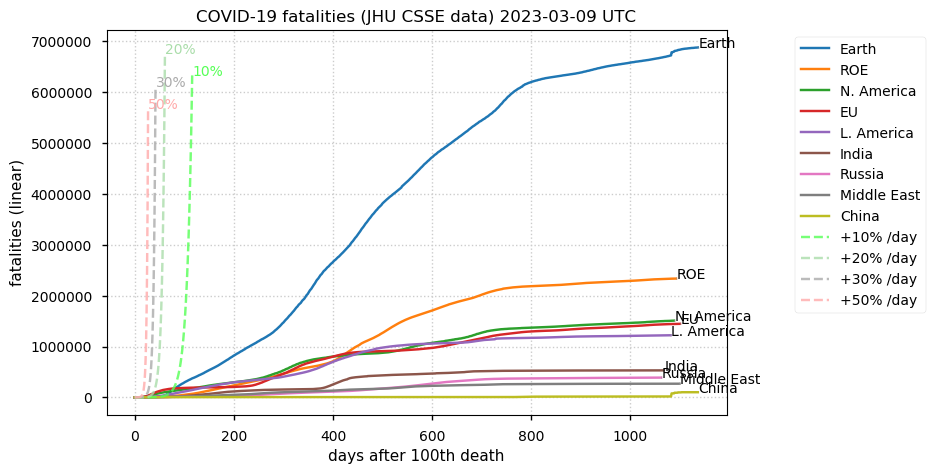
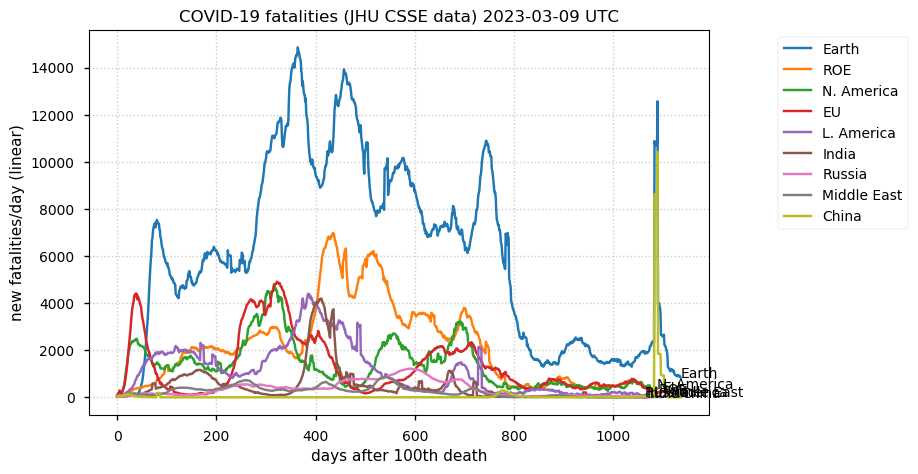
Global (2023-03-10 21:16 UTC), updates daily
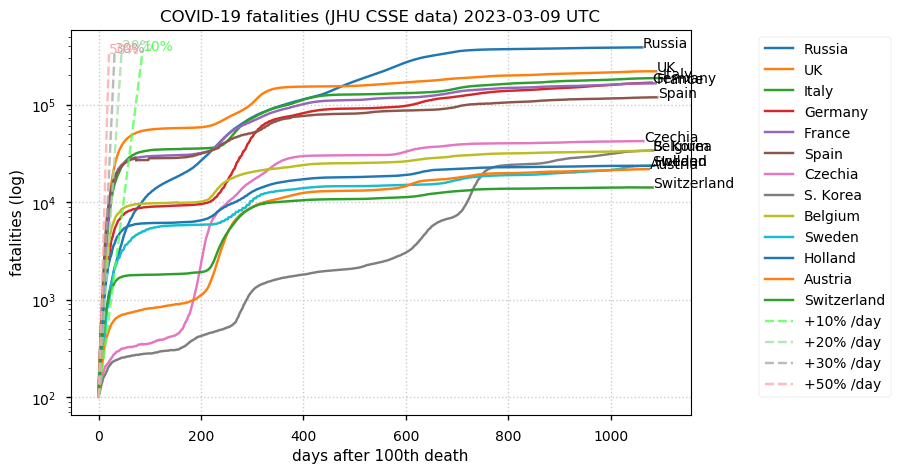
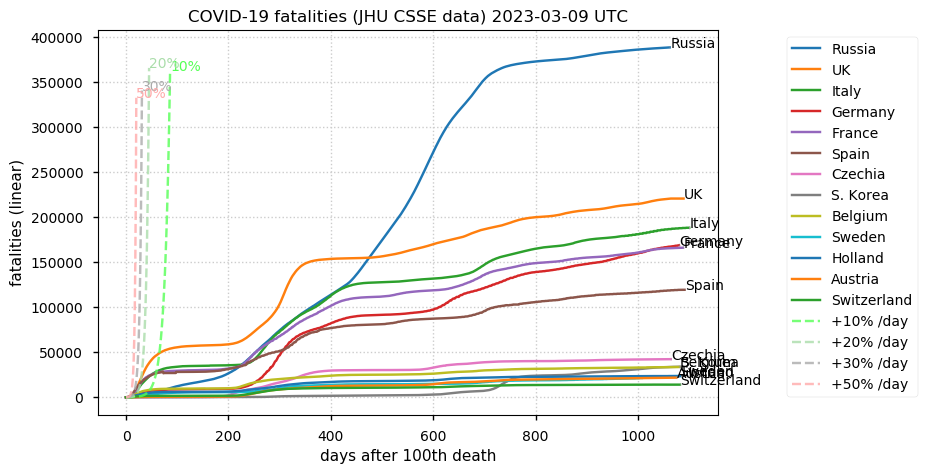
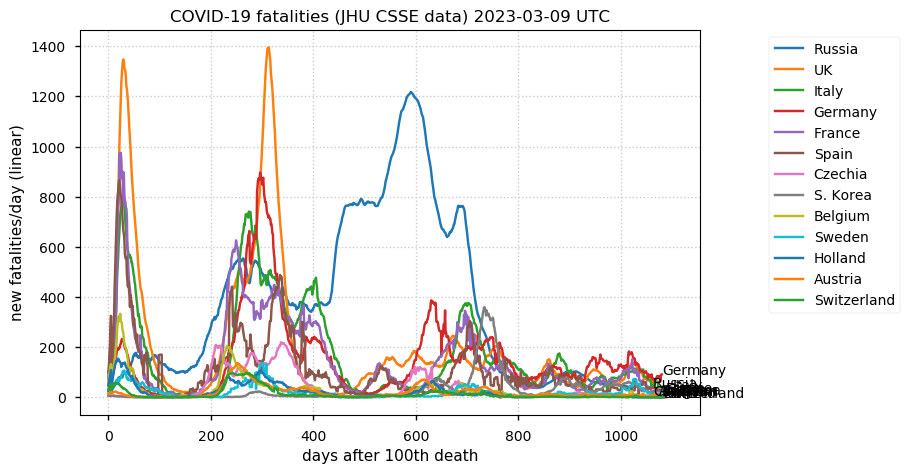
Selected Industrial Countries (2023-03-10 21:16 UTC), updates daily
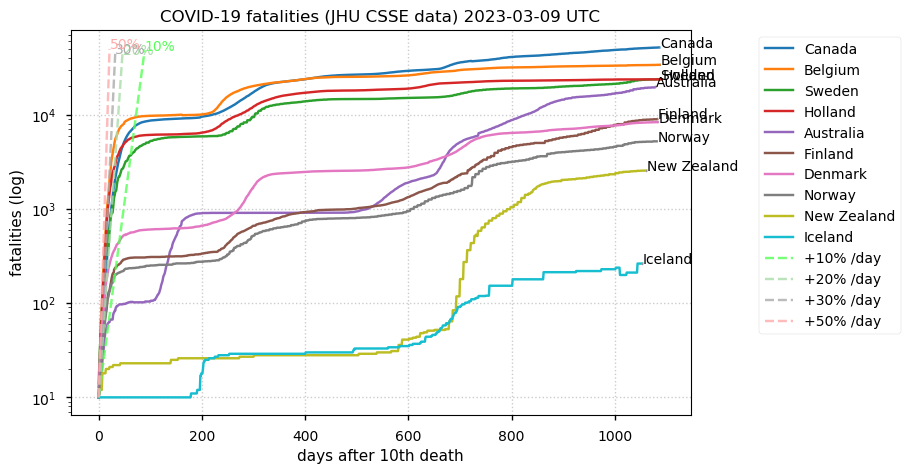
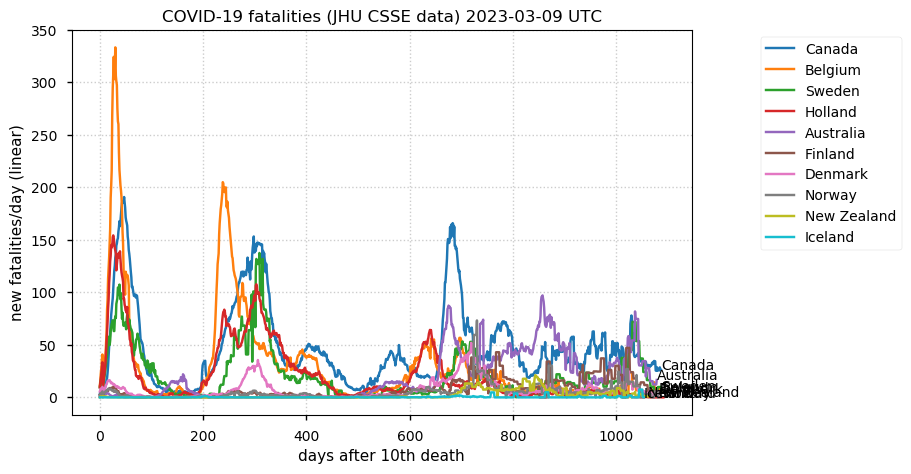
Polar/Nordic Grouping (2023-03-10 21:16 UTC), updates daily
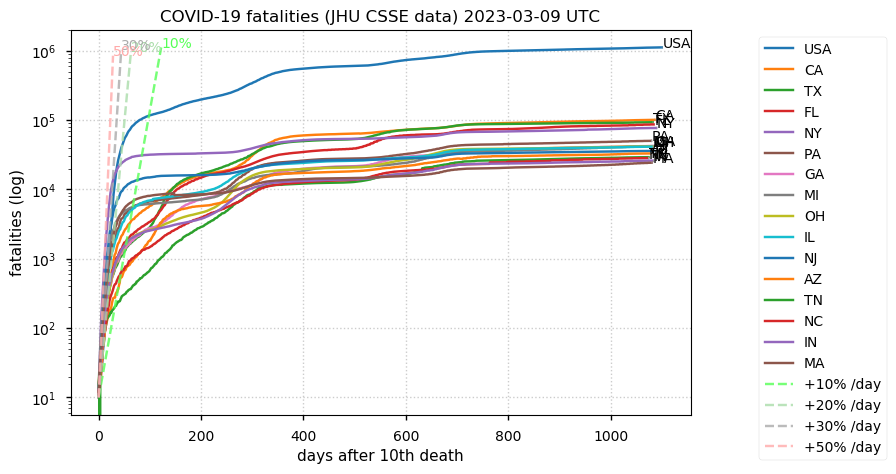
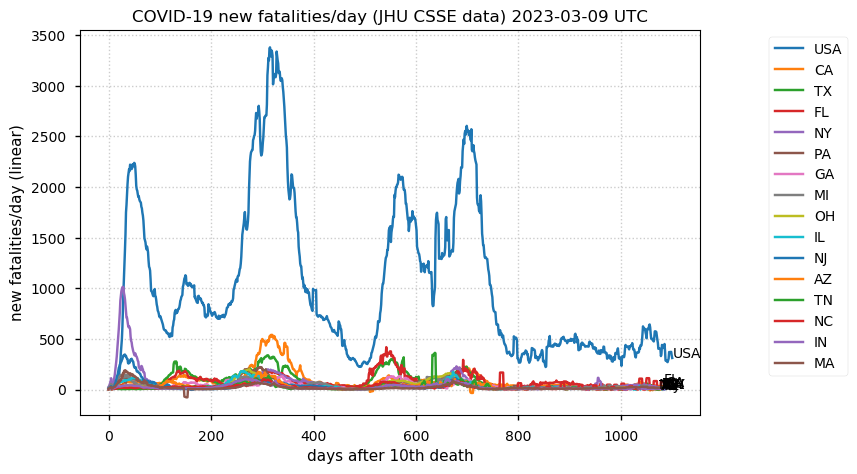
15 Most Affected US States (2023-03-10 21:16 UTC), updates daily
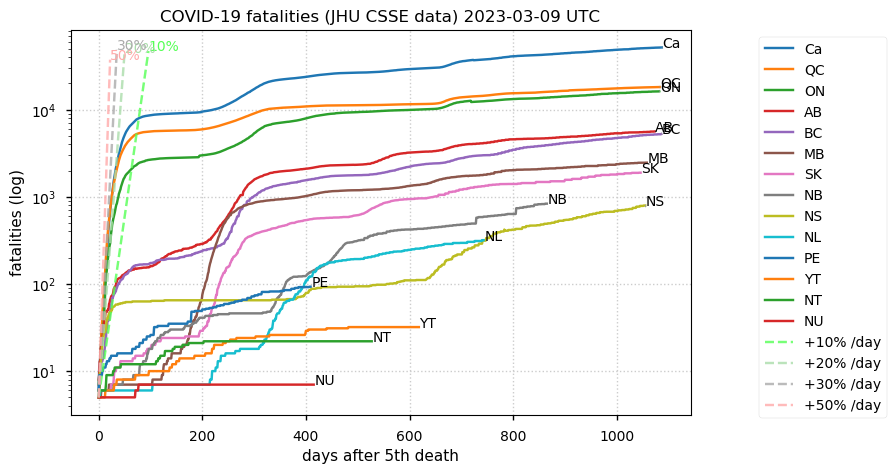
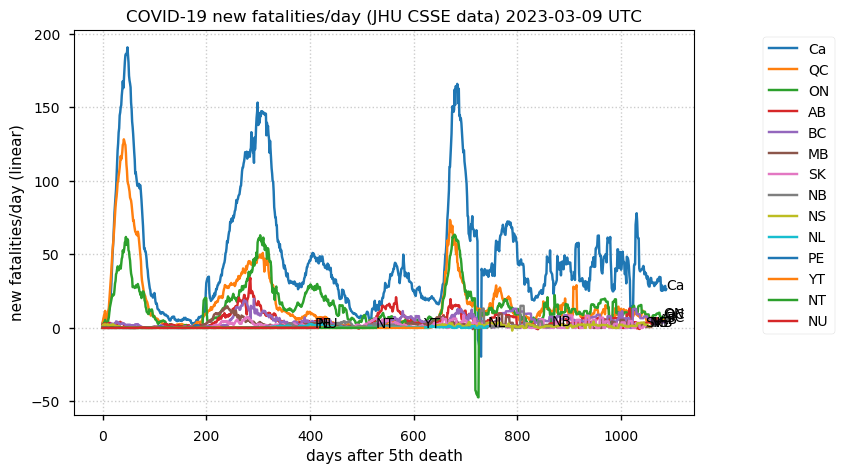
Canadian Provinces (2023-03-10 21:16 UTC), updates daily
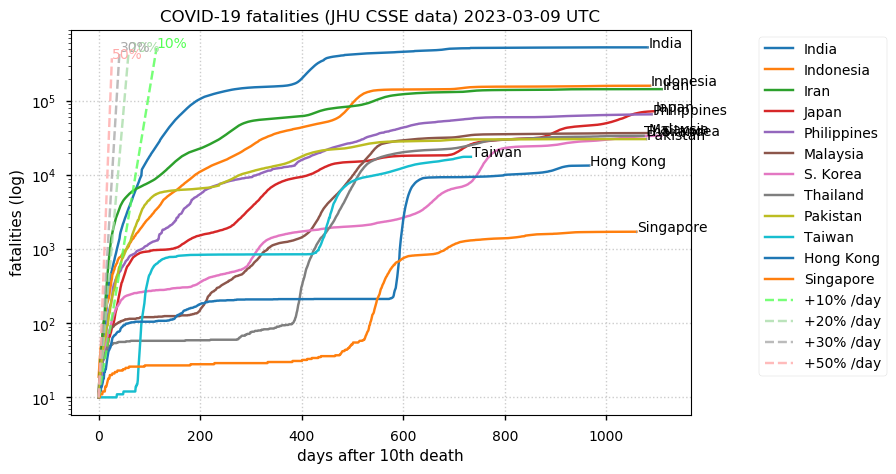
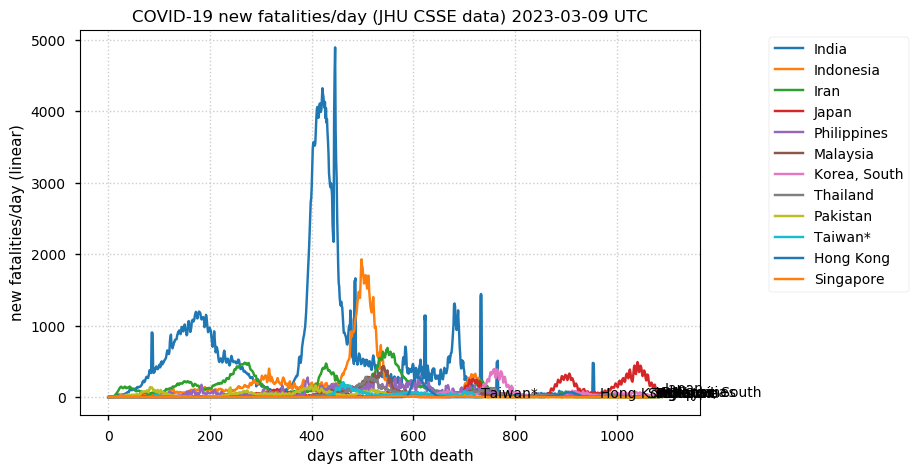
Selected Asian Countries (2023-03-10 21:16 UTC), updates daily
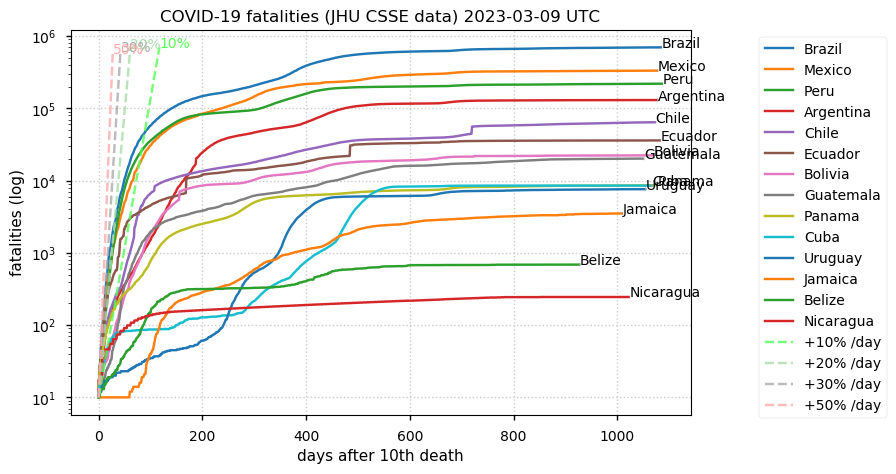
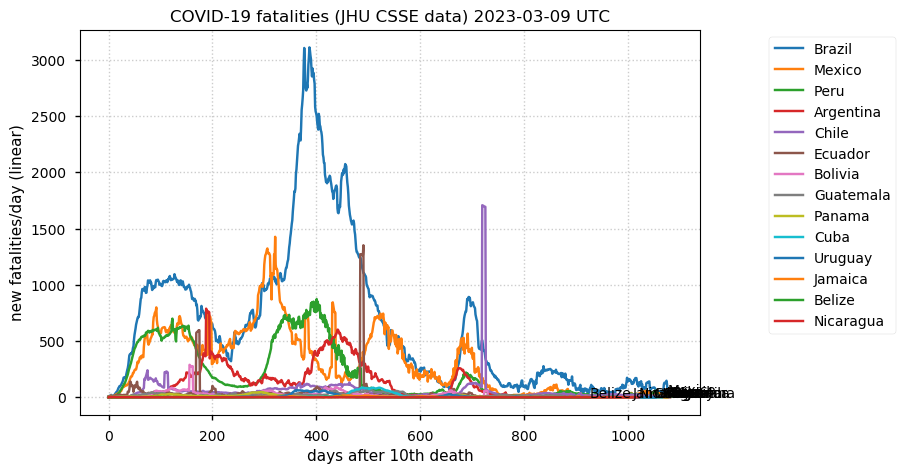
Selected Latin America Countries (2023-03-10 21:16 UTC), updates daily
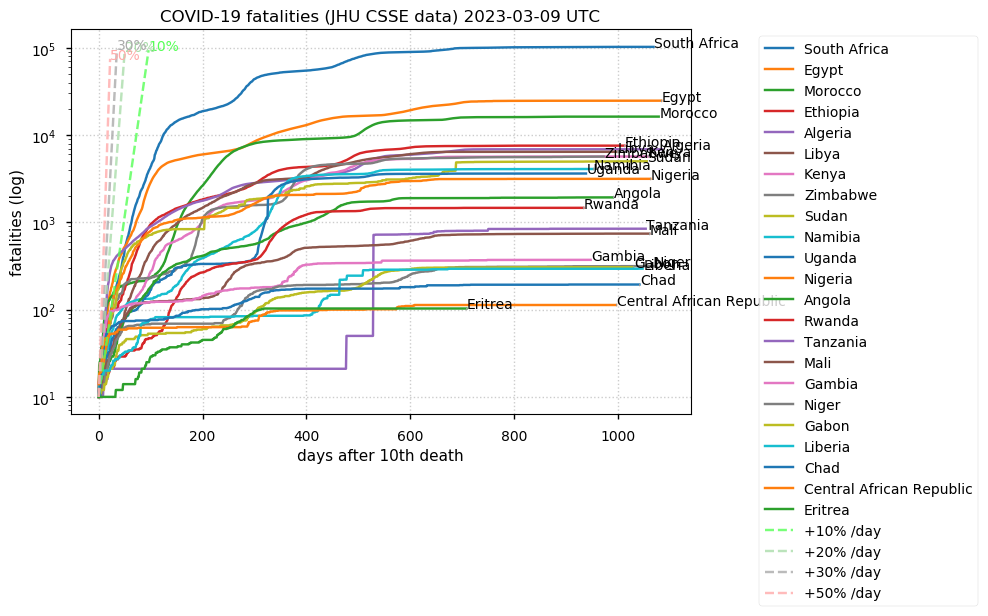
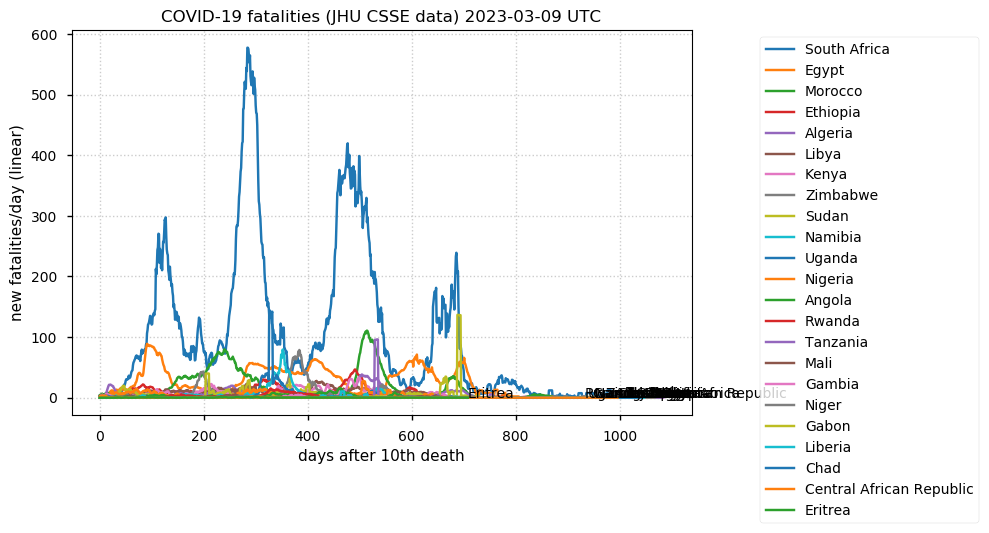
Selected African Countries (2023-03-10 21:16 UTC), updates daily
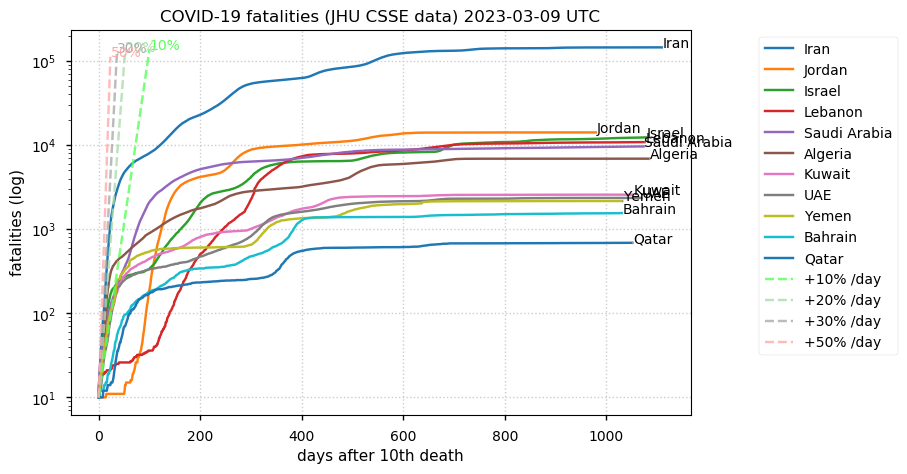
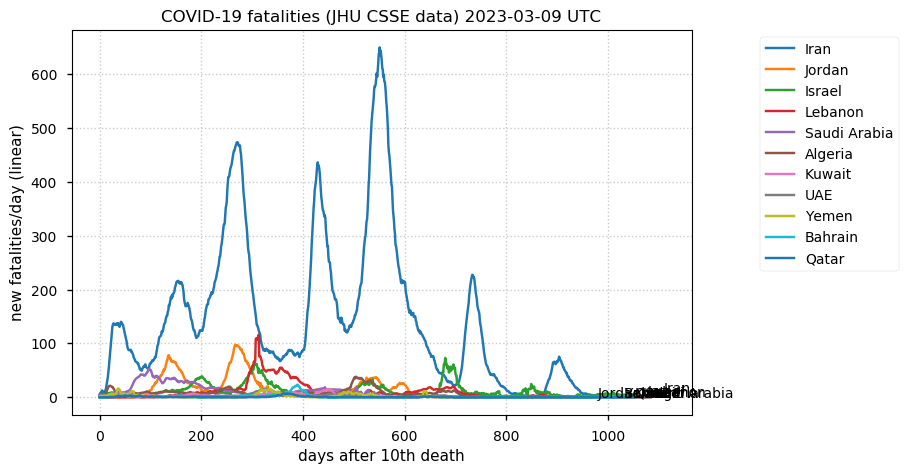
Selected Middle East Countries (2023-03-10 21:16 UTC), updates daily
Johns Hopkins data (2020-03-25 00:07 UTC)
- COVID-19 attributed deaths [CSV]
- COVID-19 confirmed cases [CSV]
- COVID-19 attributed deaths (US States) [CSV]
- COVID-19 confirmed cases (US States) [CSV]
- CSSEGISandData host site [github]
Notes
- This page updates daily, within 1 hour of 0:00 UTC.
- The Johns Hopkins data does not tabulate data from today (UTC): today's data will be added at midnight UTC.
- The Johns Hopkins data is provided to them by regional and national governments and may not be accurate or up-to-date. Use
this information cautiously.
- Colored dashed lines represent recursive functions where y(0) = 100 (CA Provinces, y(0) = 10):
- 50%: y(day+1) = y(day) × 1.5;
- 30%: y(day+1) = y(day) × 1.3;
- 20%: y(day+1) = y(day) × 1.2; &
- 10%: y(day+1) = y(day) × 1.1.
- The code for generating this page is available at
github and
gitlab